BREAKDOWN
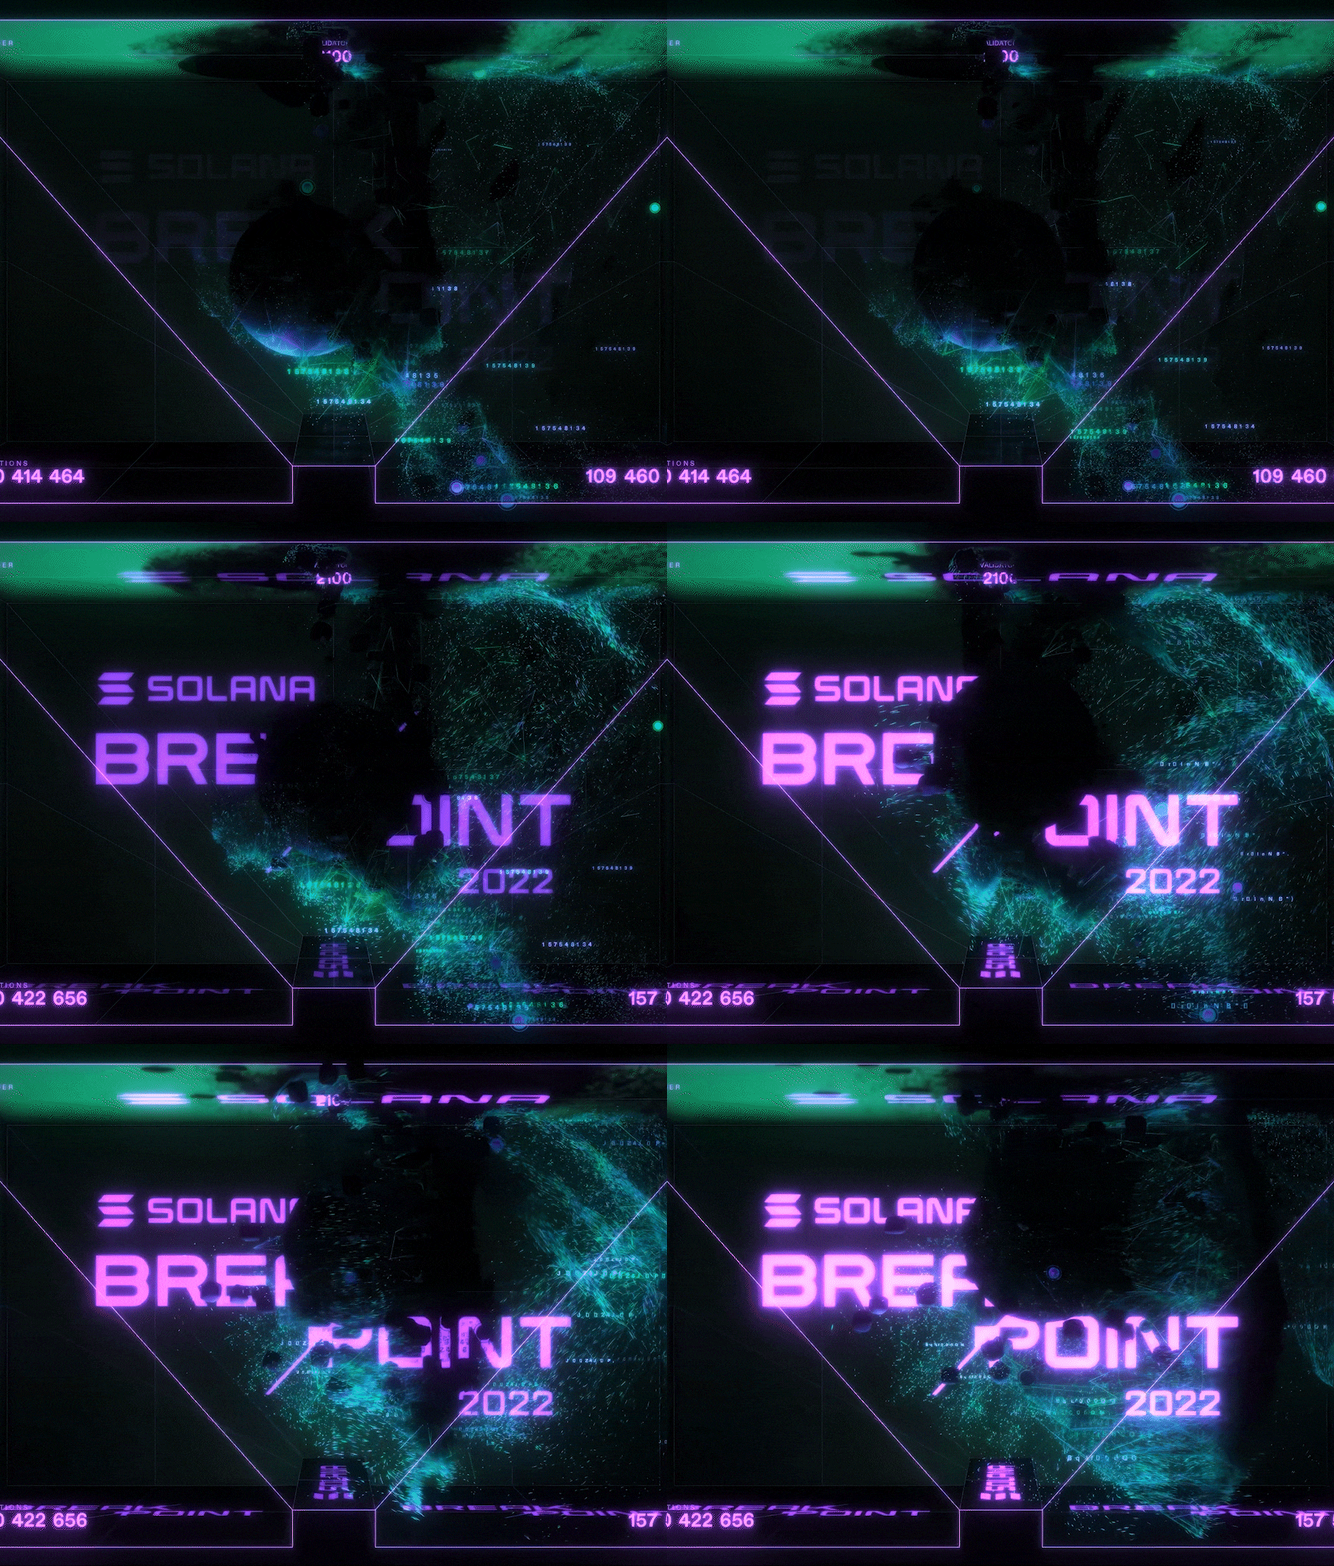
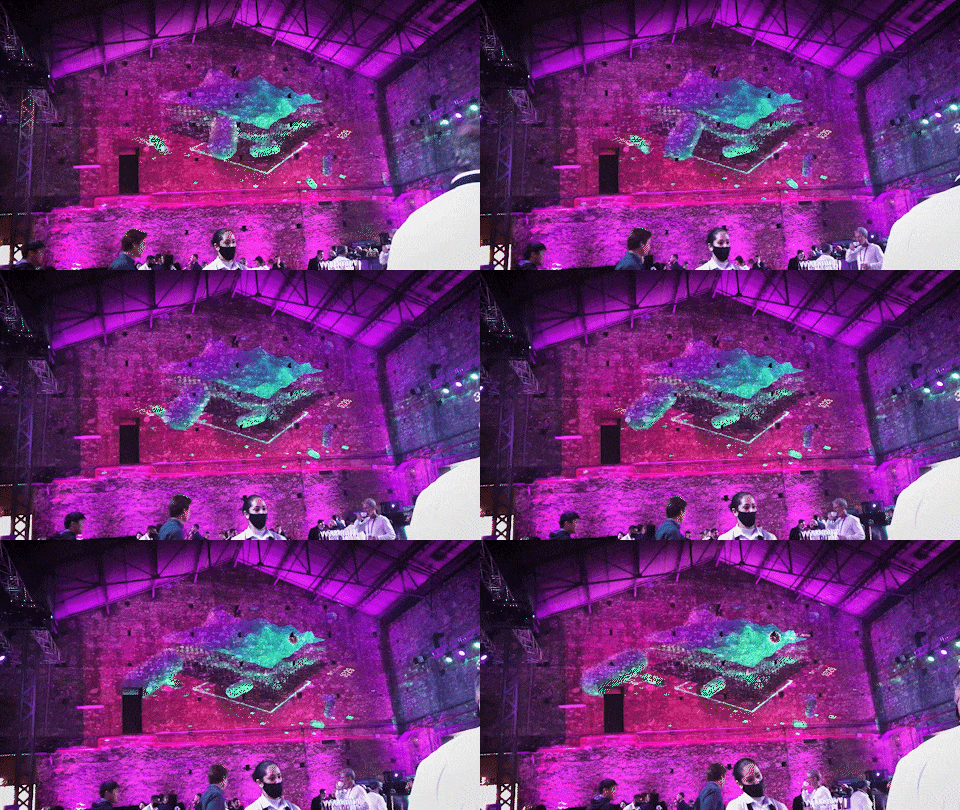
For the Solana BREAKPOINT conference of 2021, we made some real-time data display projections that took different data from solanabeach.io, using JS.
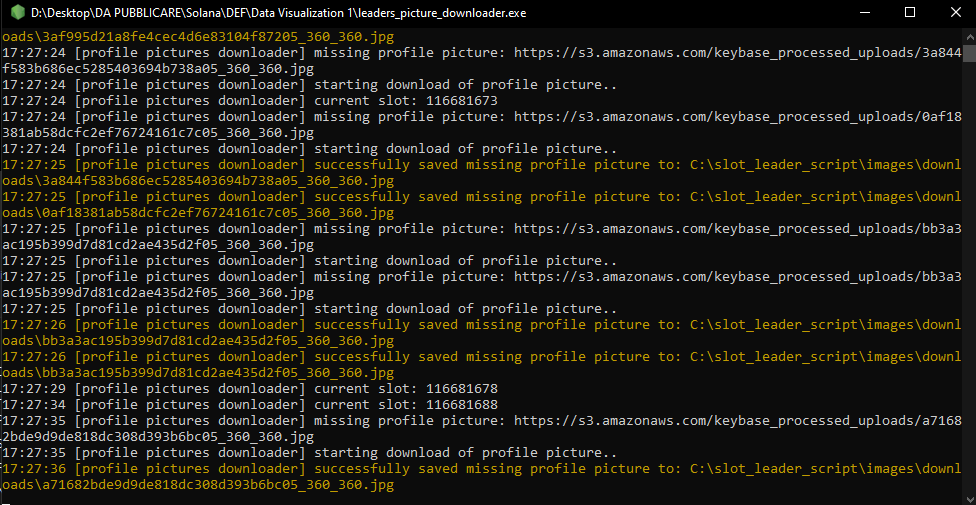
The first script was made to download the avatar's images of the Validators in real time.
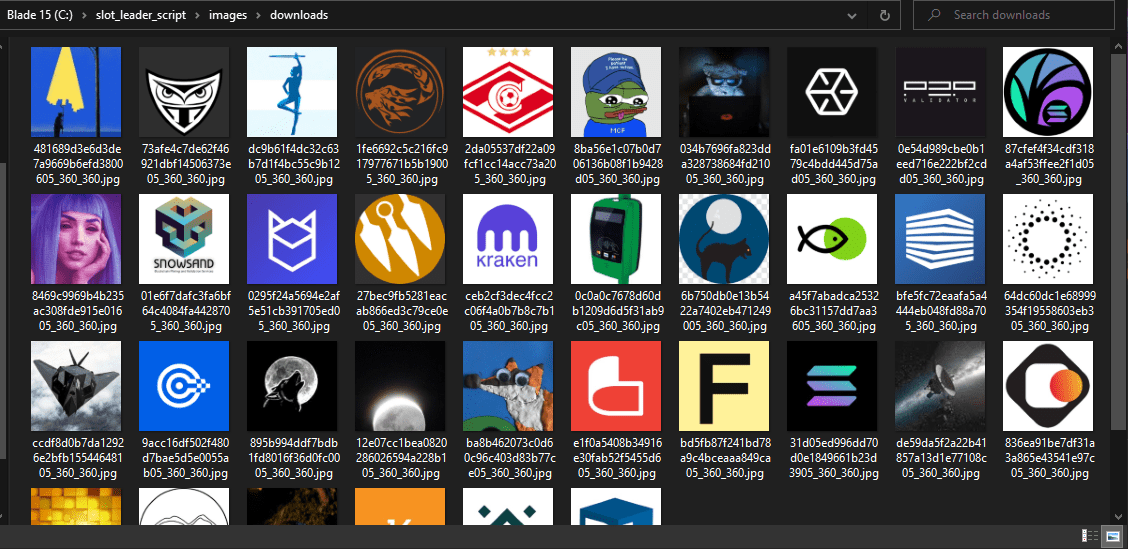
And the second was used to assign these images with the right file location.
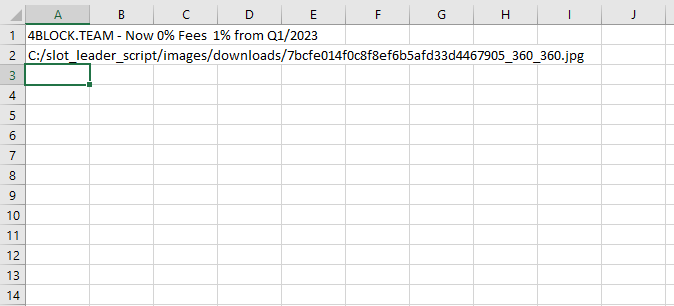
In the end, in Notch was implemented a .js file to interpret these data and change the numerical valius of the scene.
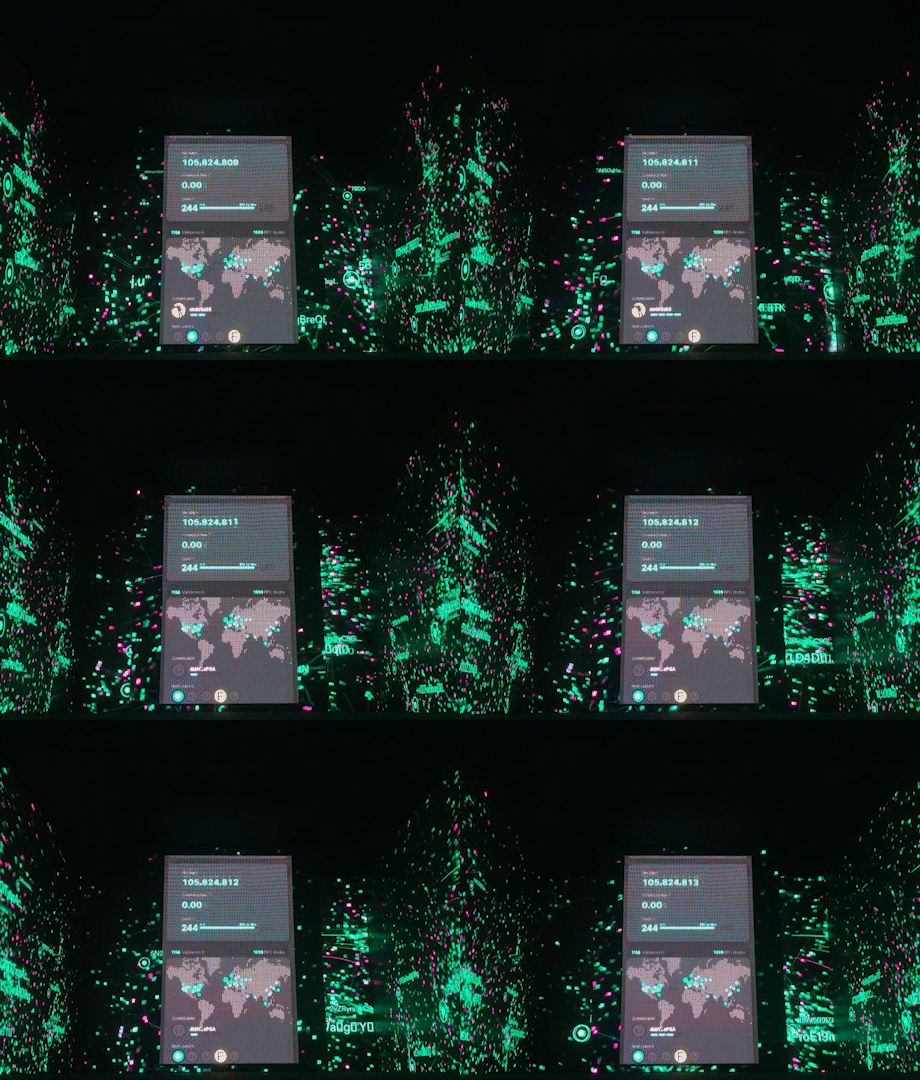
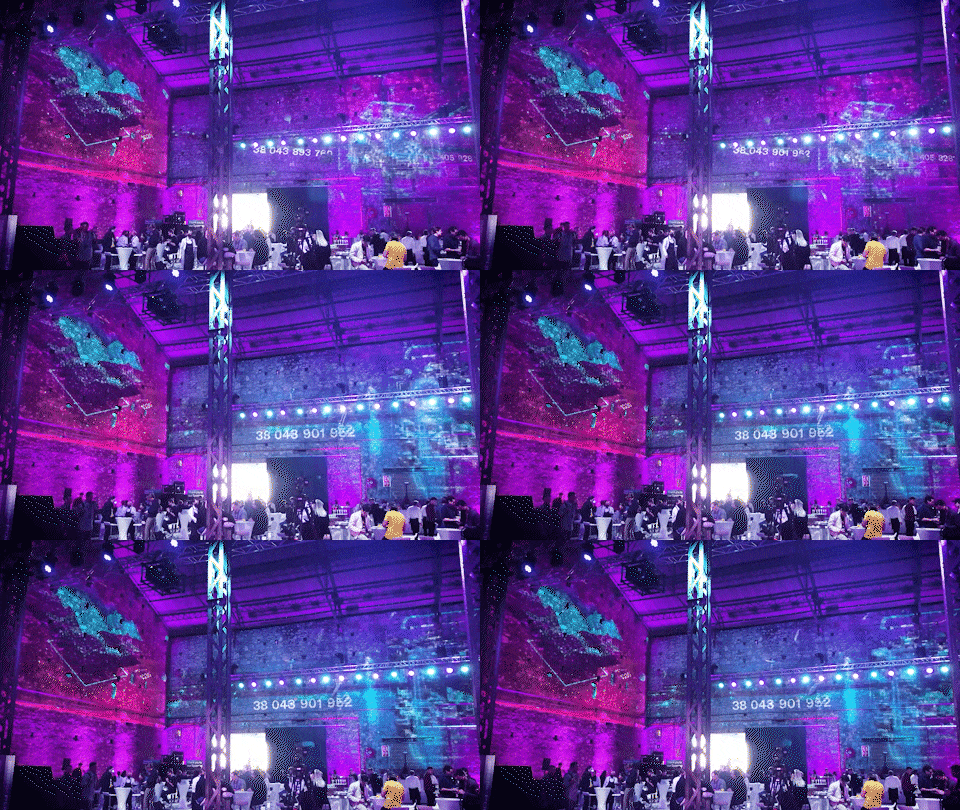
The second projection was on the biggest wall and showed the sloth height and the total transactions. In this case, there wasn't an external script but all worked with two internal .JS, who downloaded data in real-time from solanabeach.io and modified the text strings of the scene.
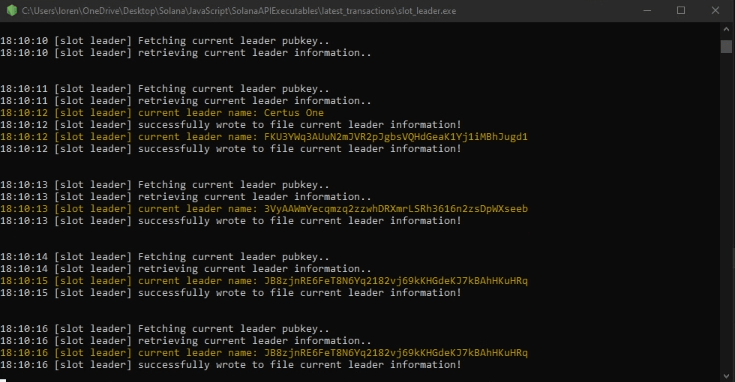
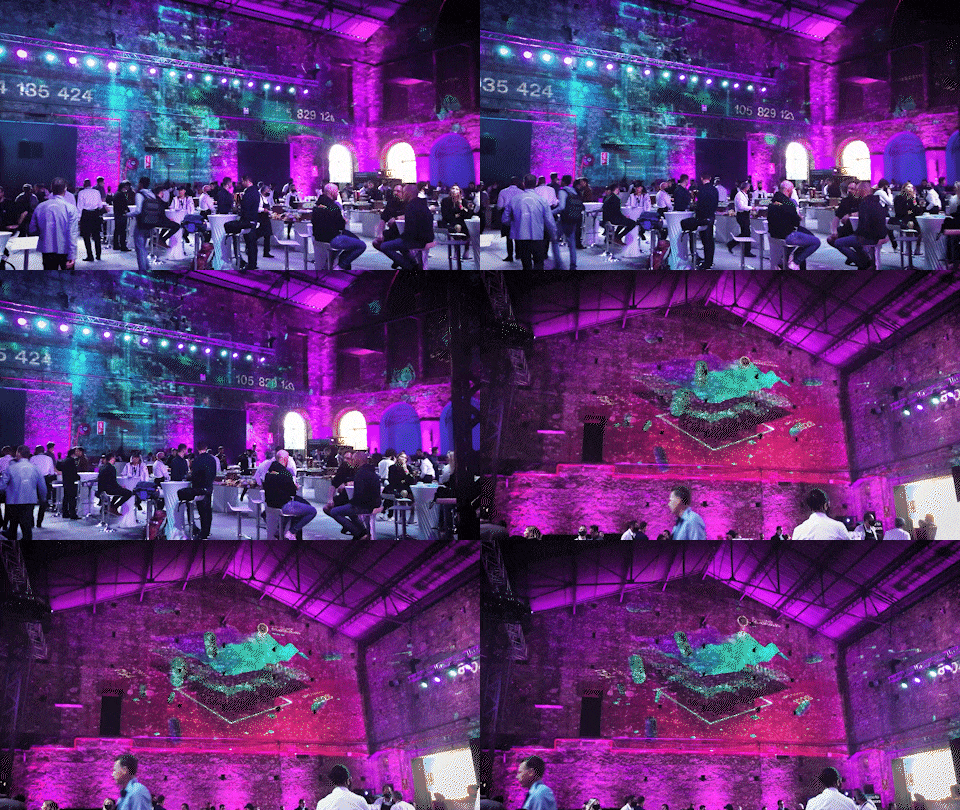
The last projection used an external .exe script to write on a .csv the latest blocks created.
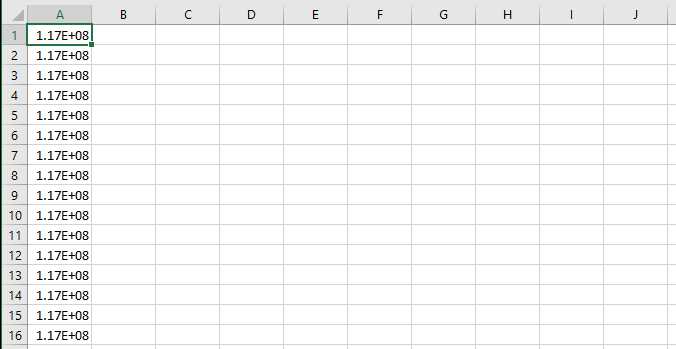
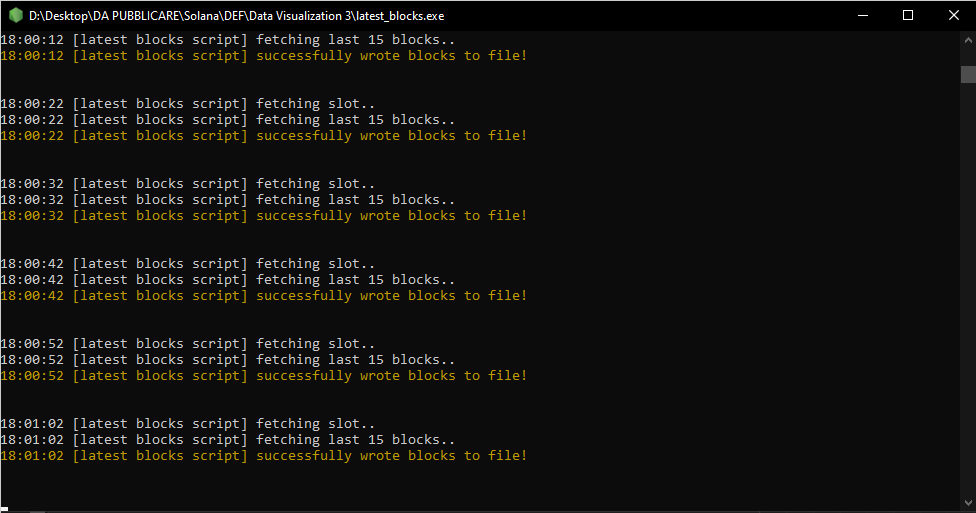
And in Notch a built-in .js readed that .csv to show the data in real-time.
My final benchmarks were made compiling the blocks and were tested using the FX-Player media server. On stage, all blocks was running for three days on a Pandoras Box media server.
RENDER
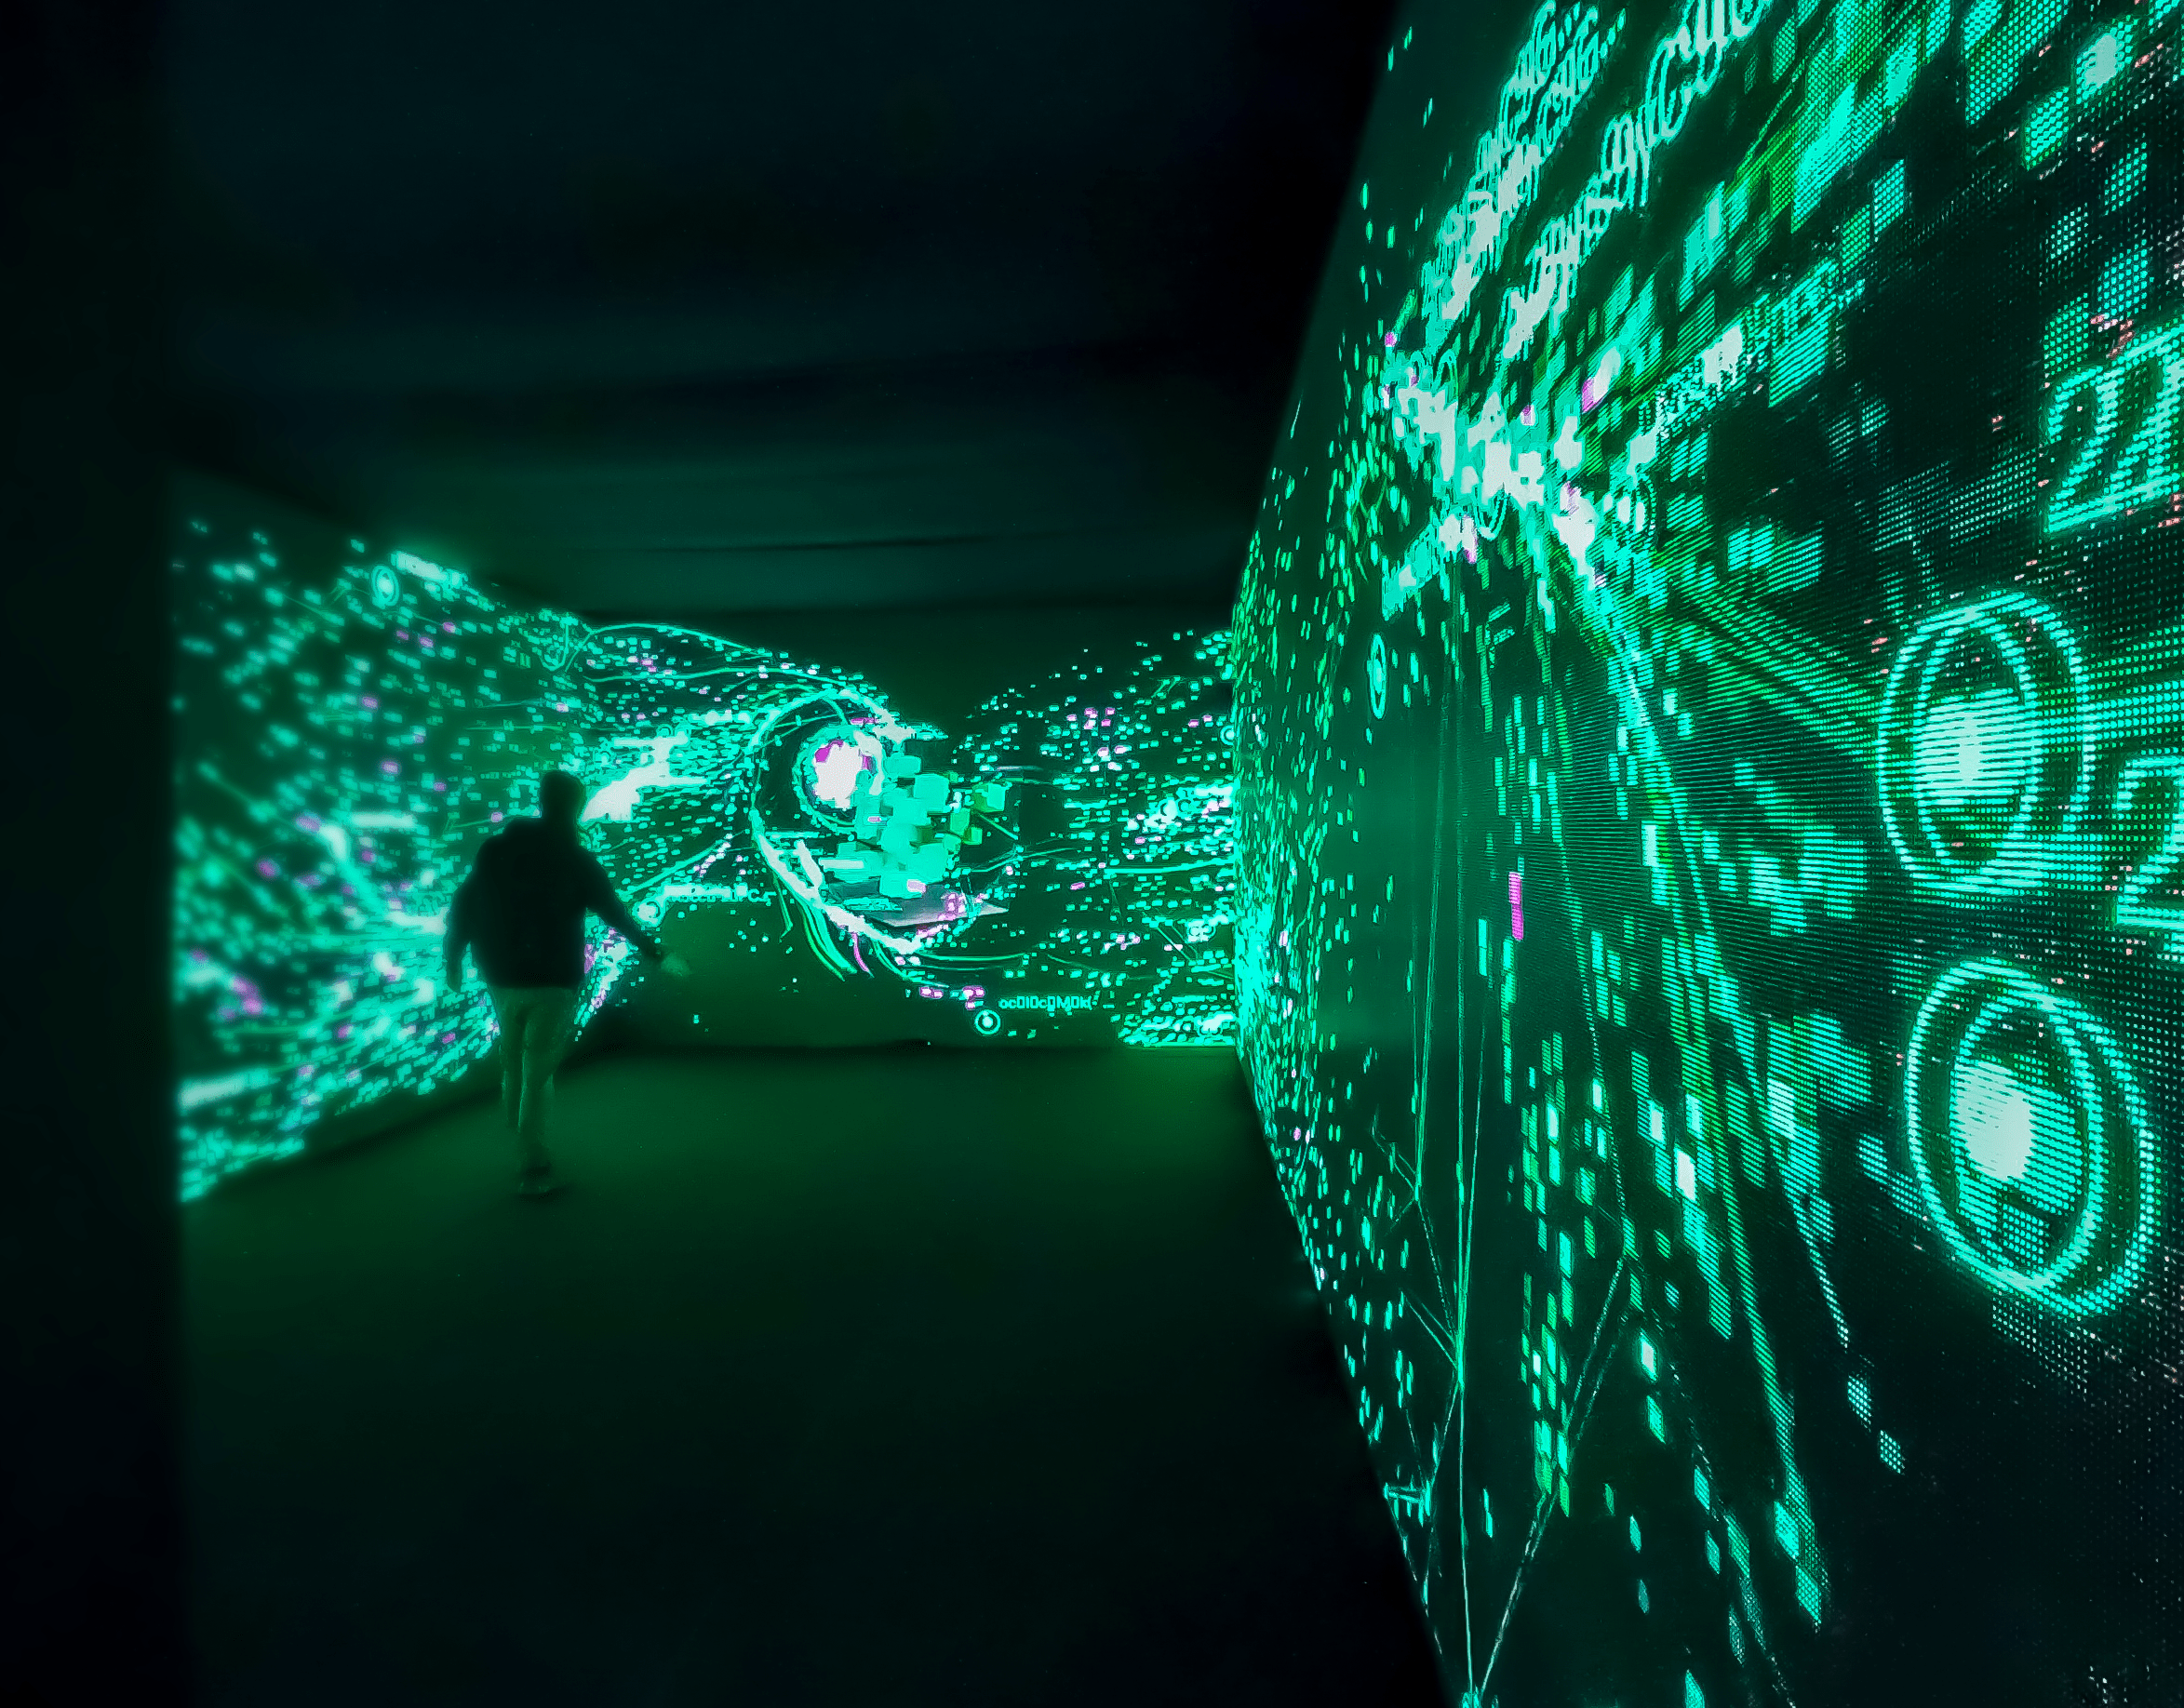
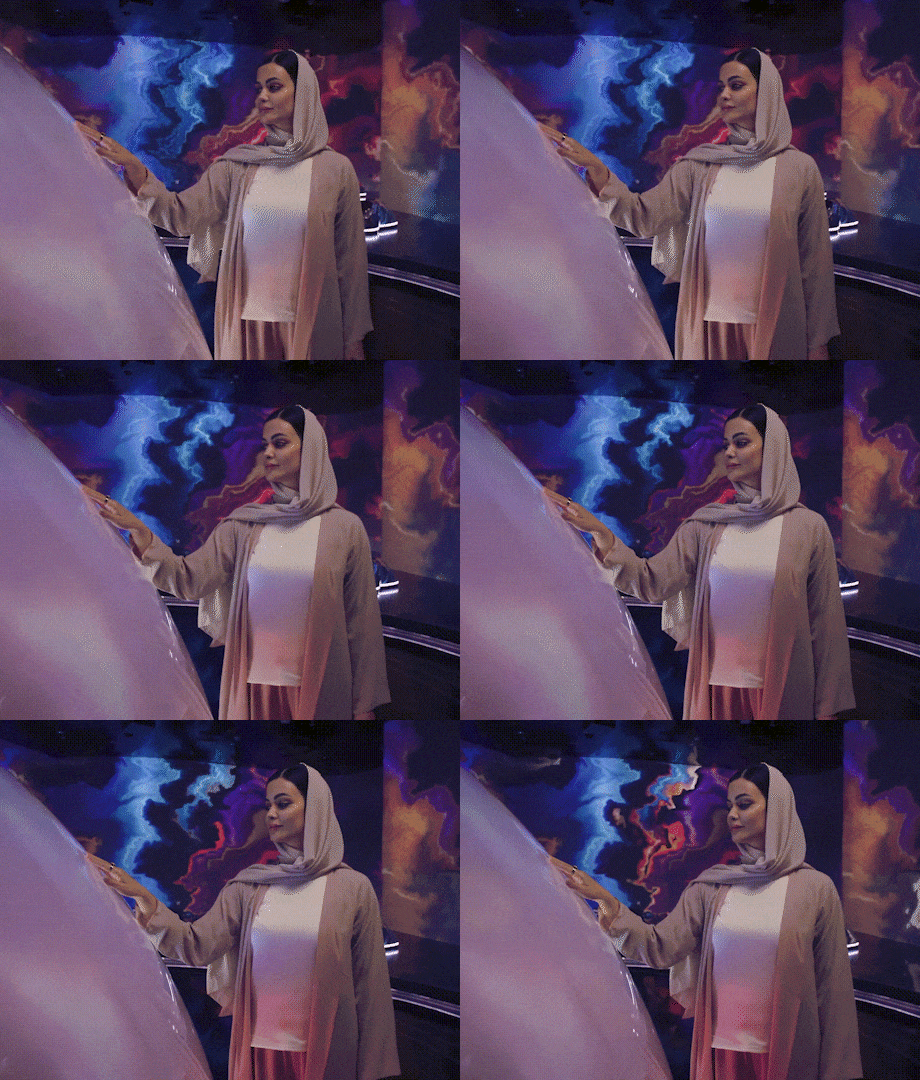
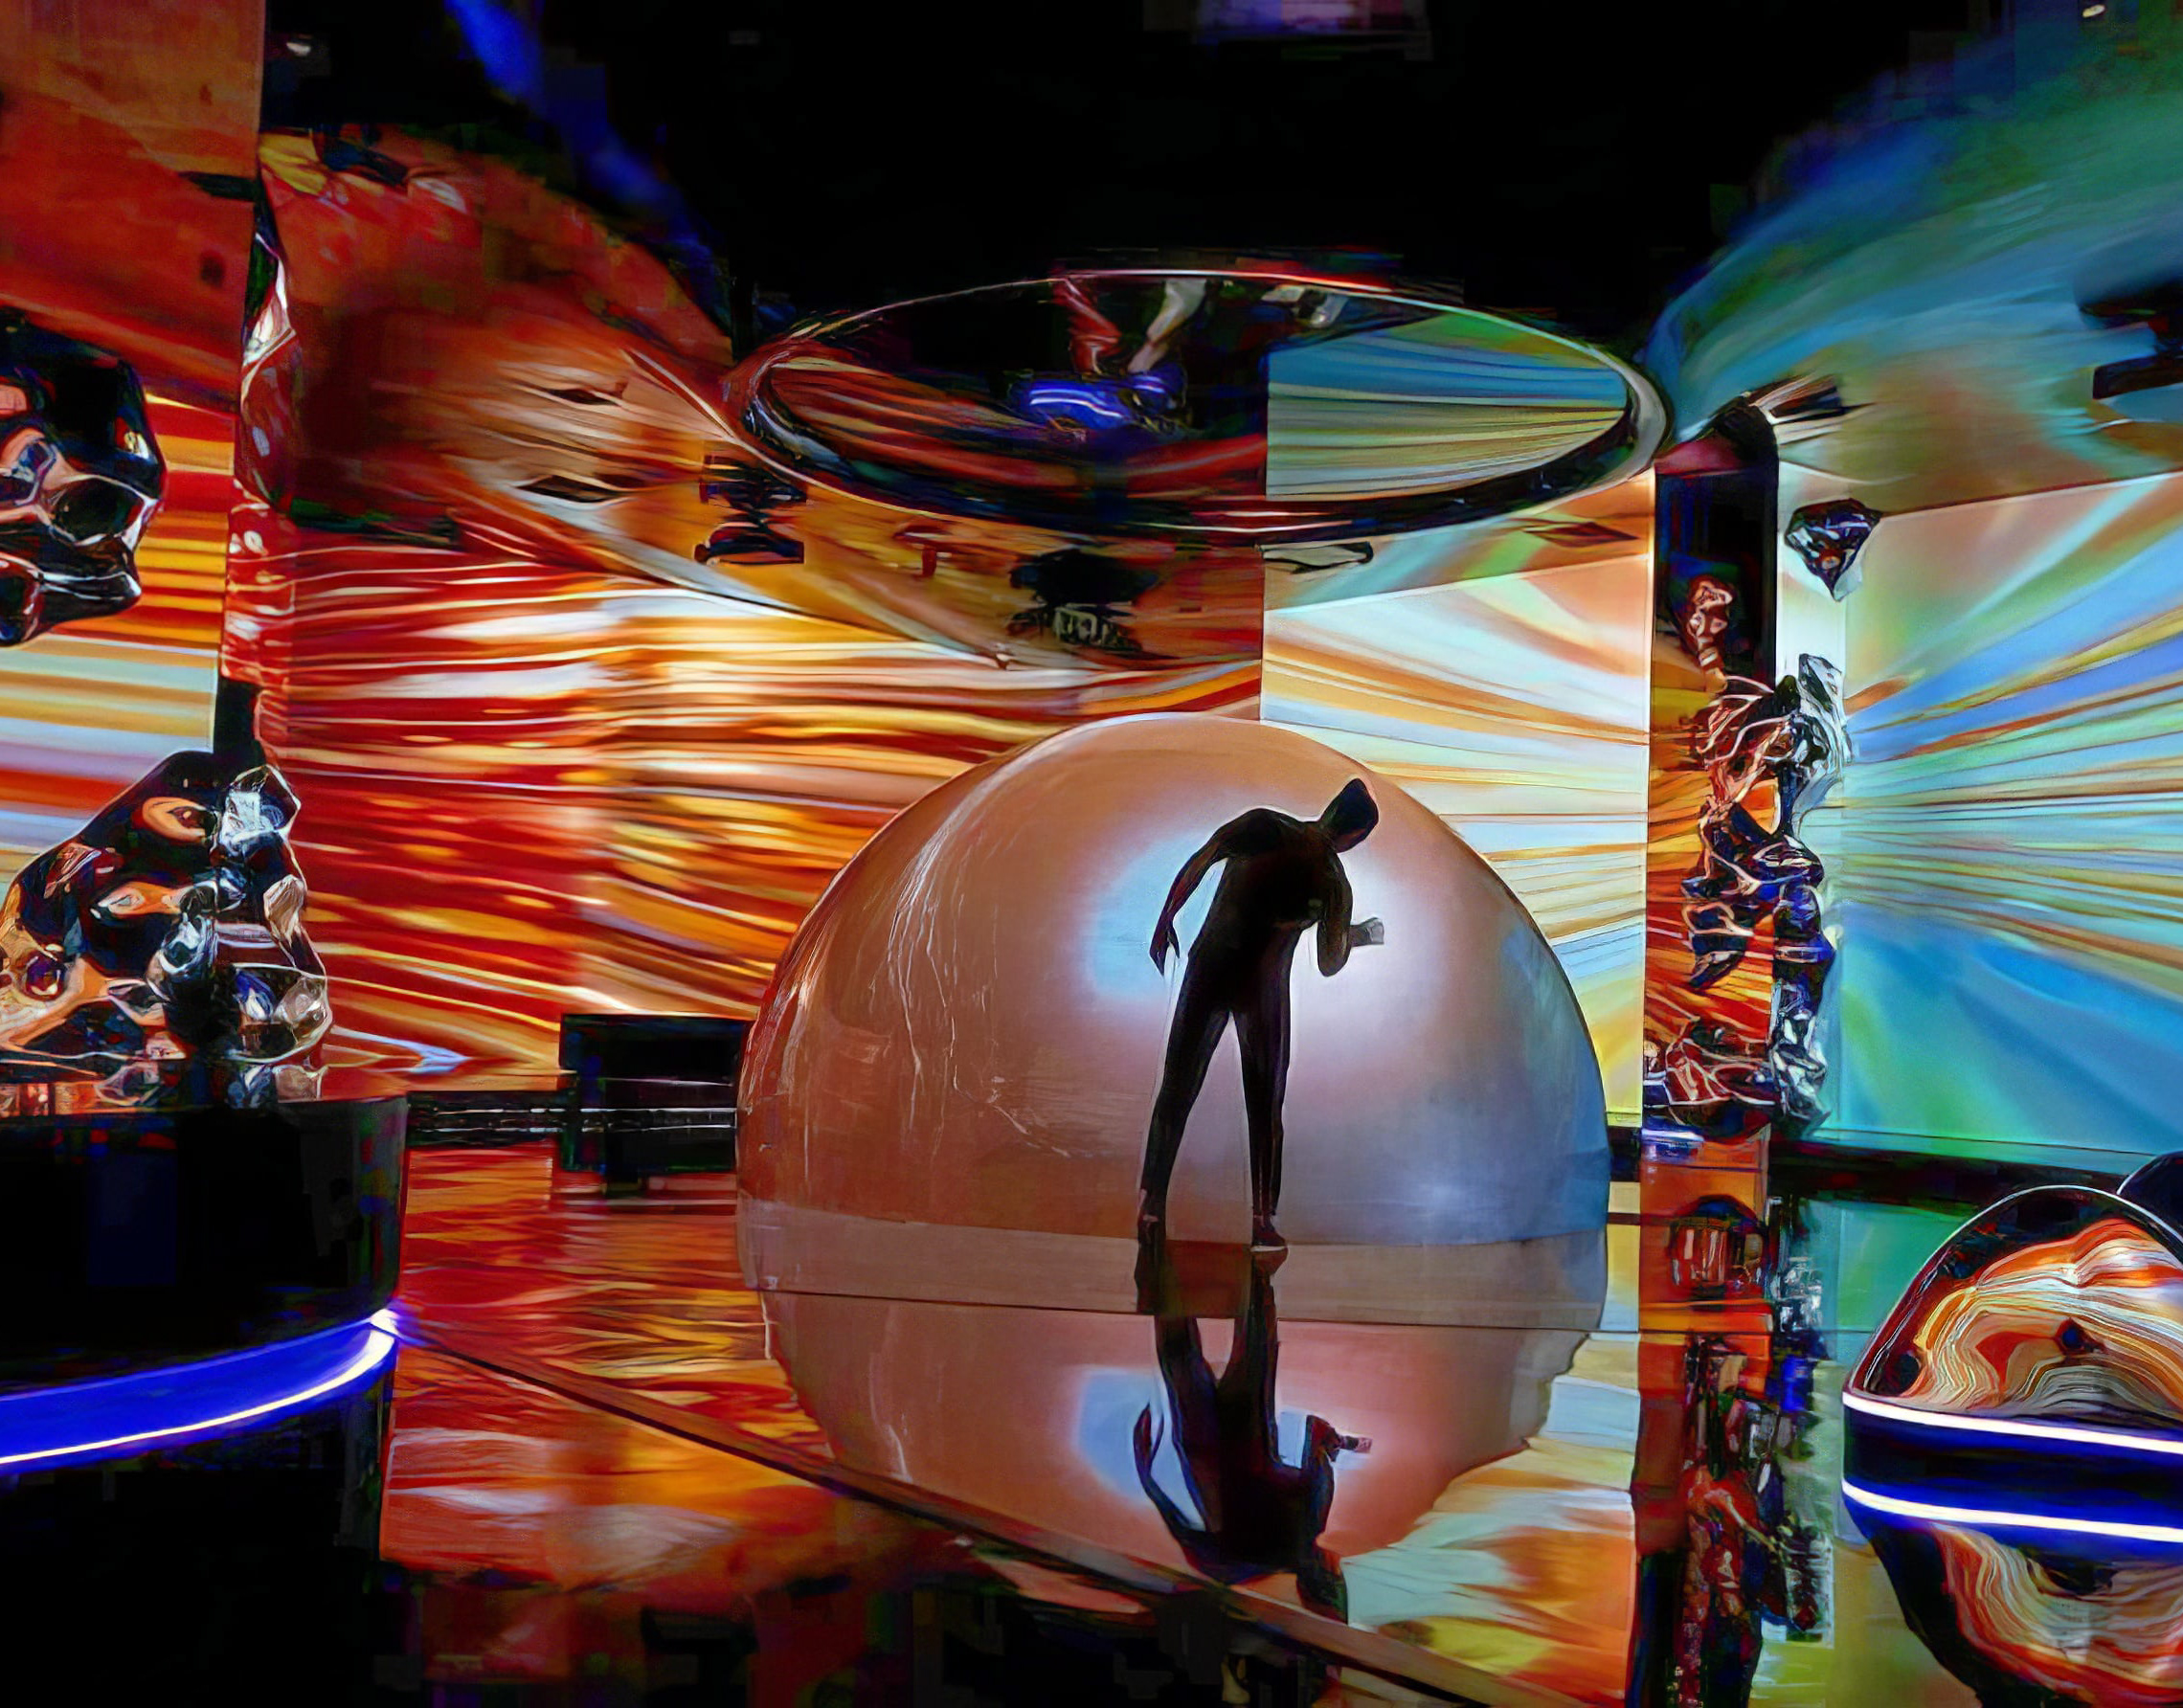
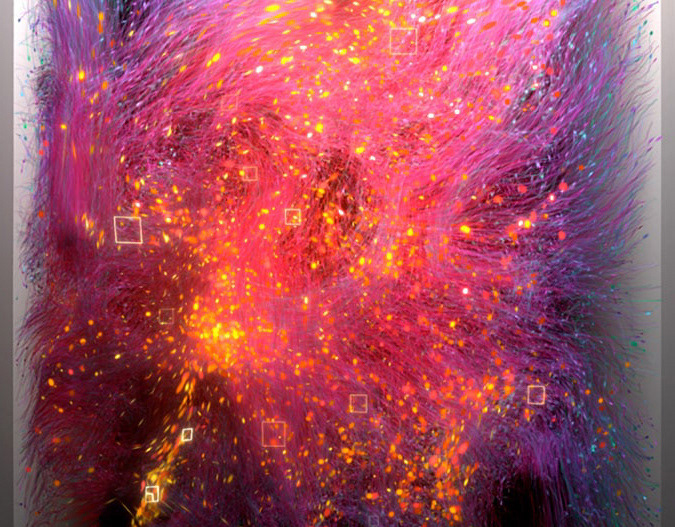
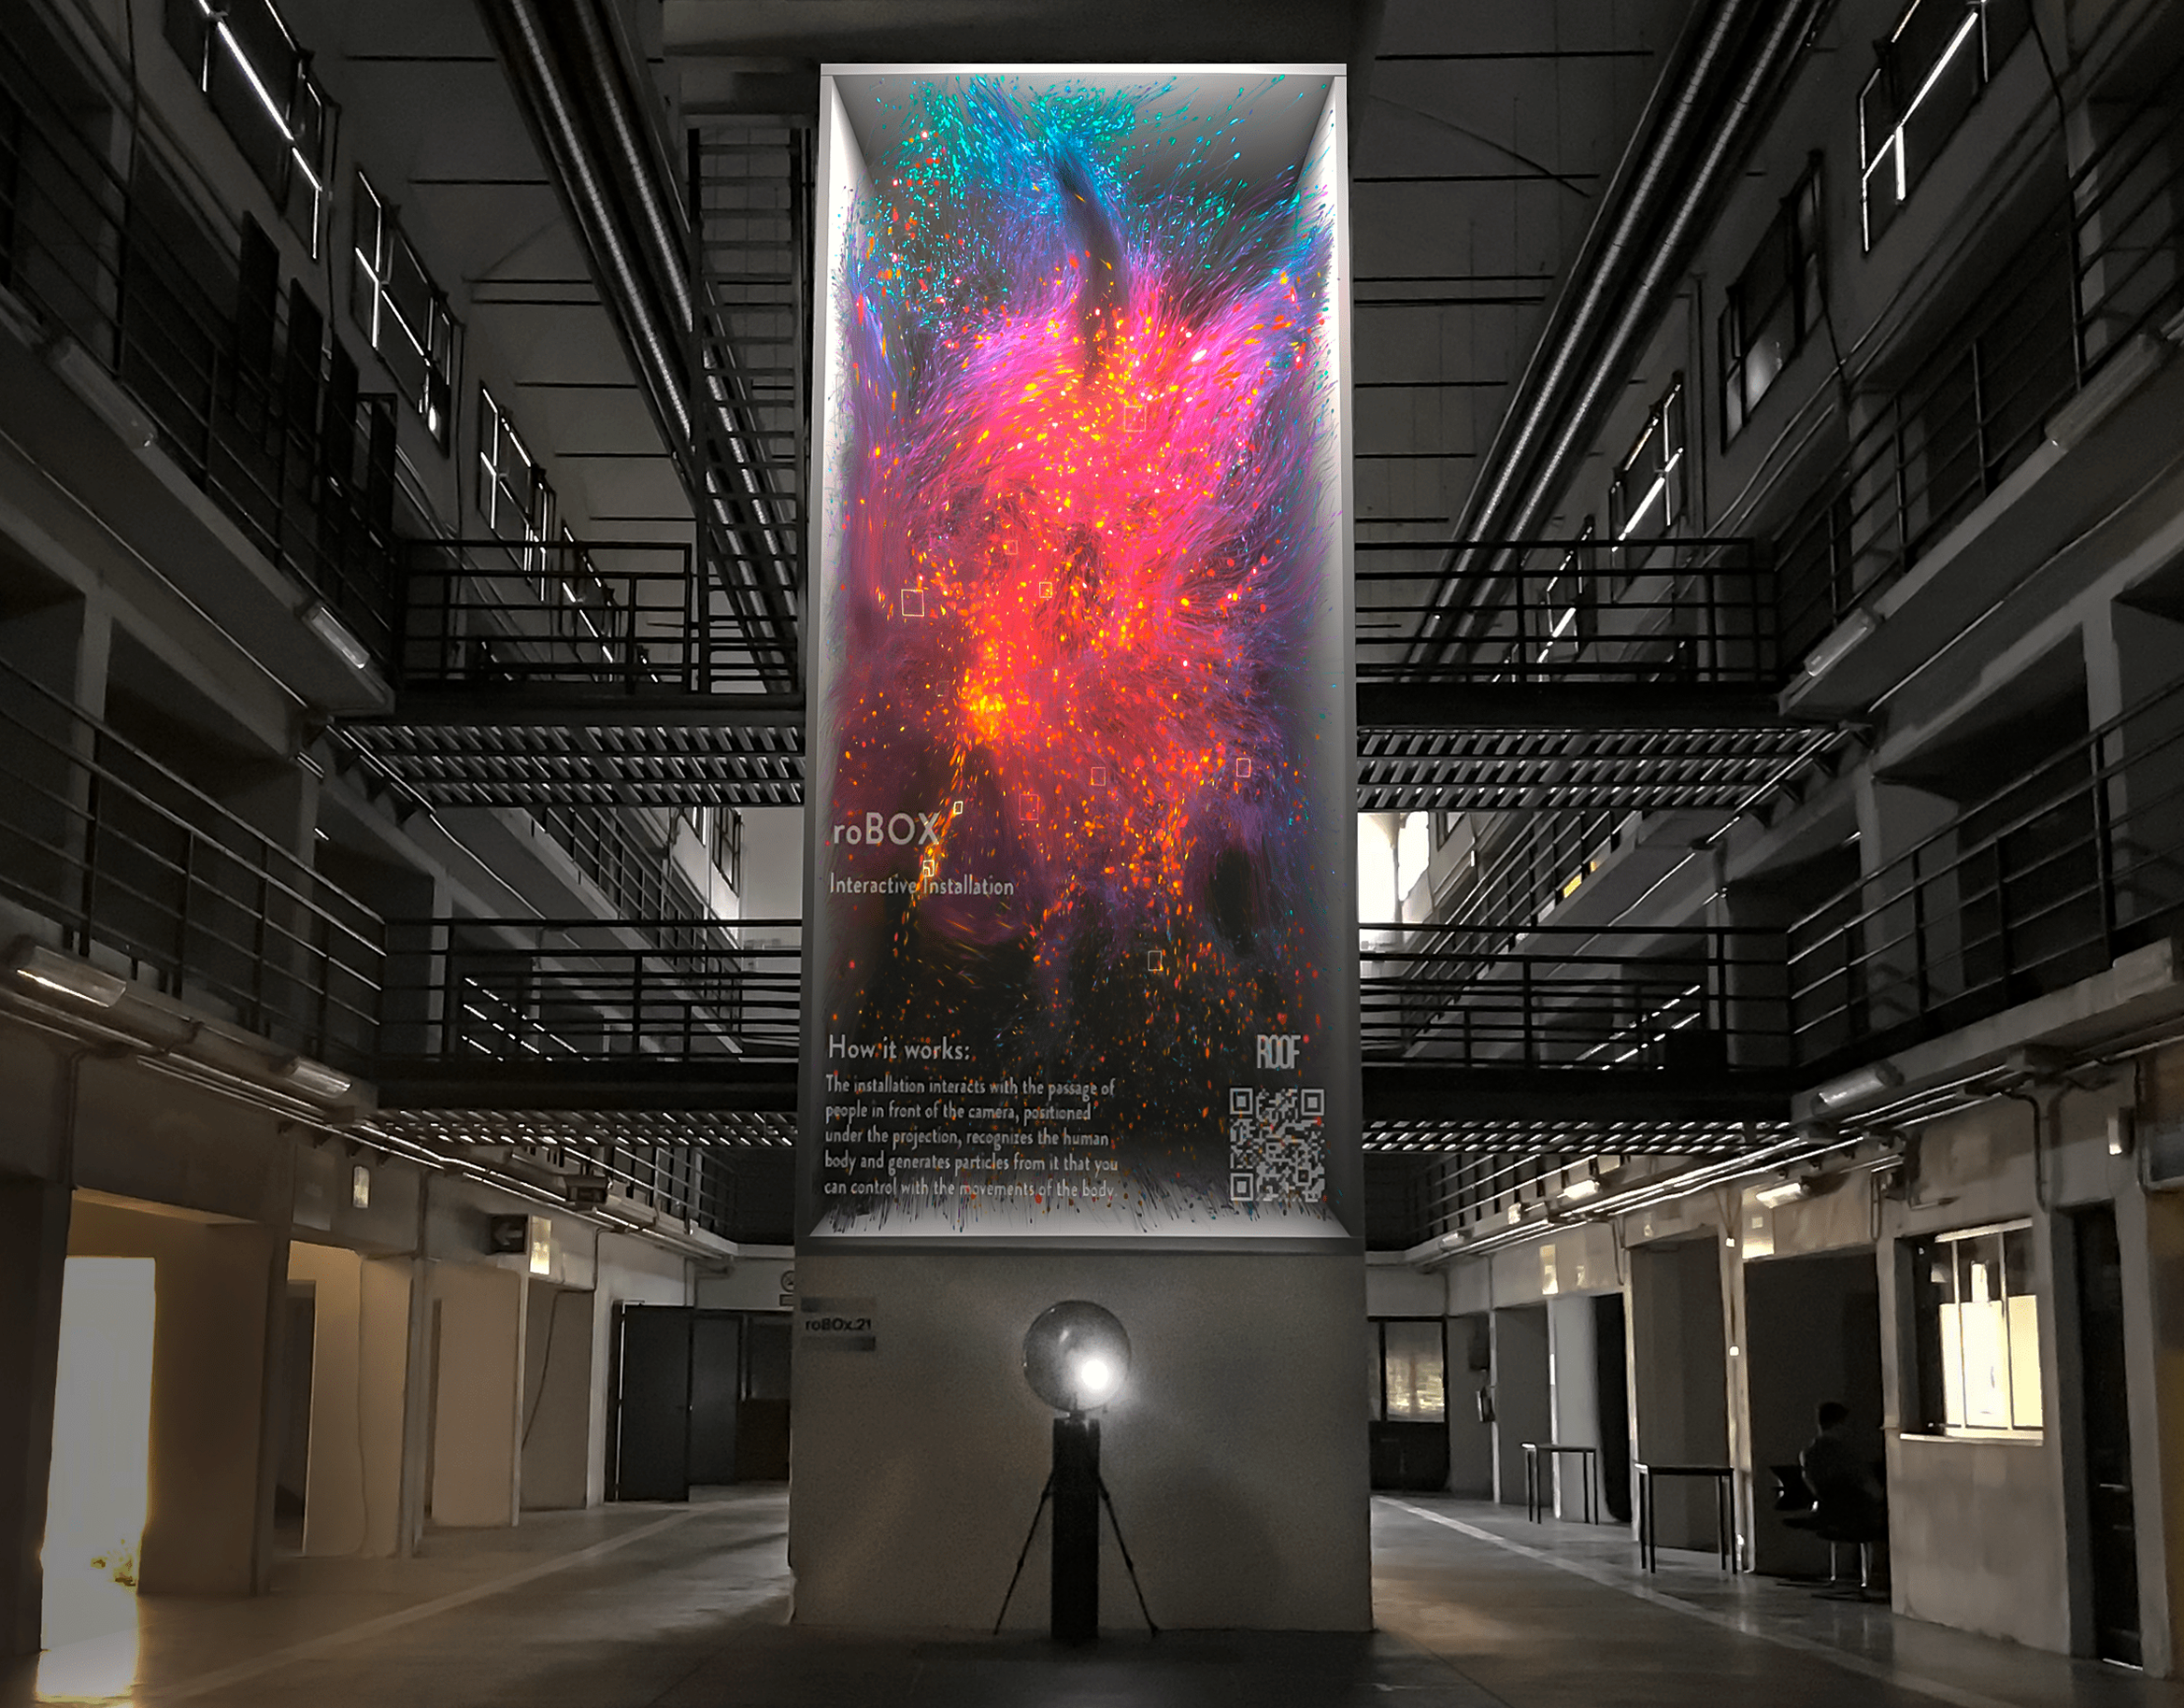
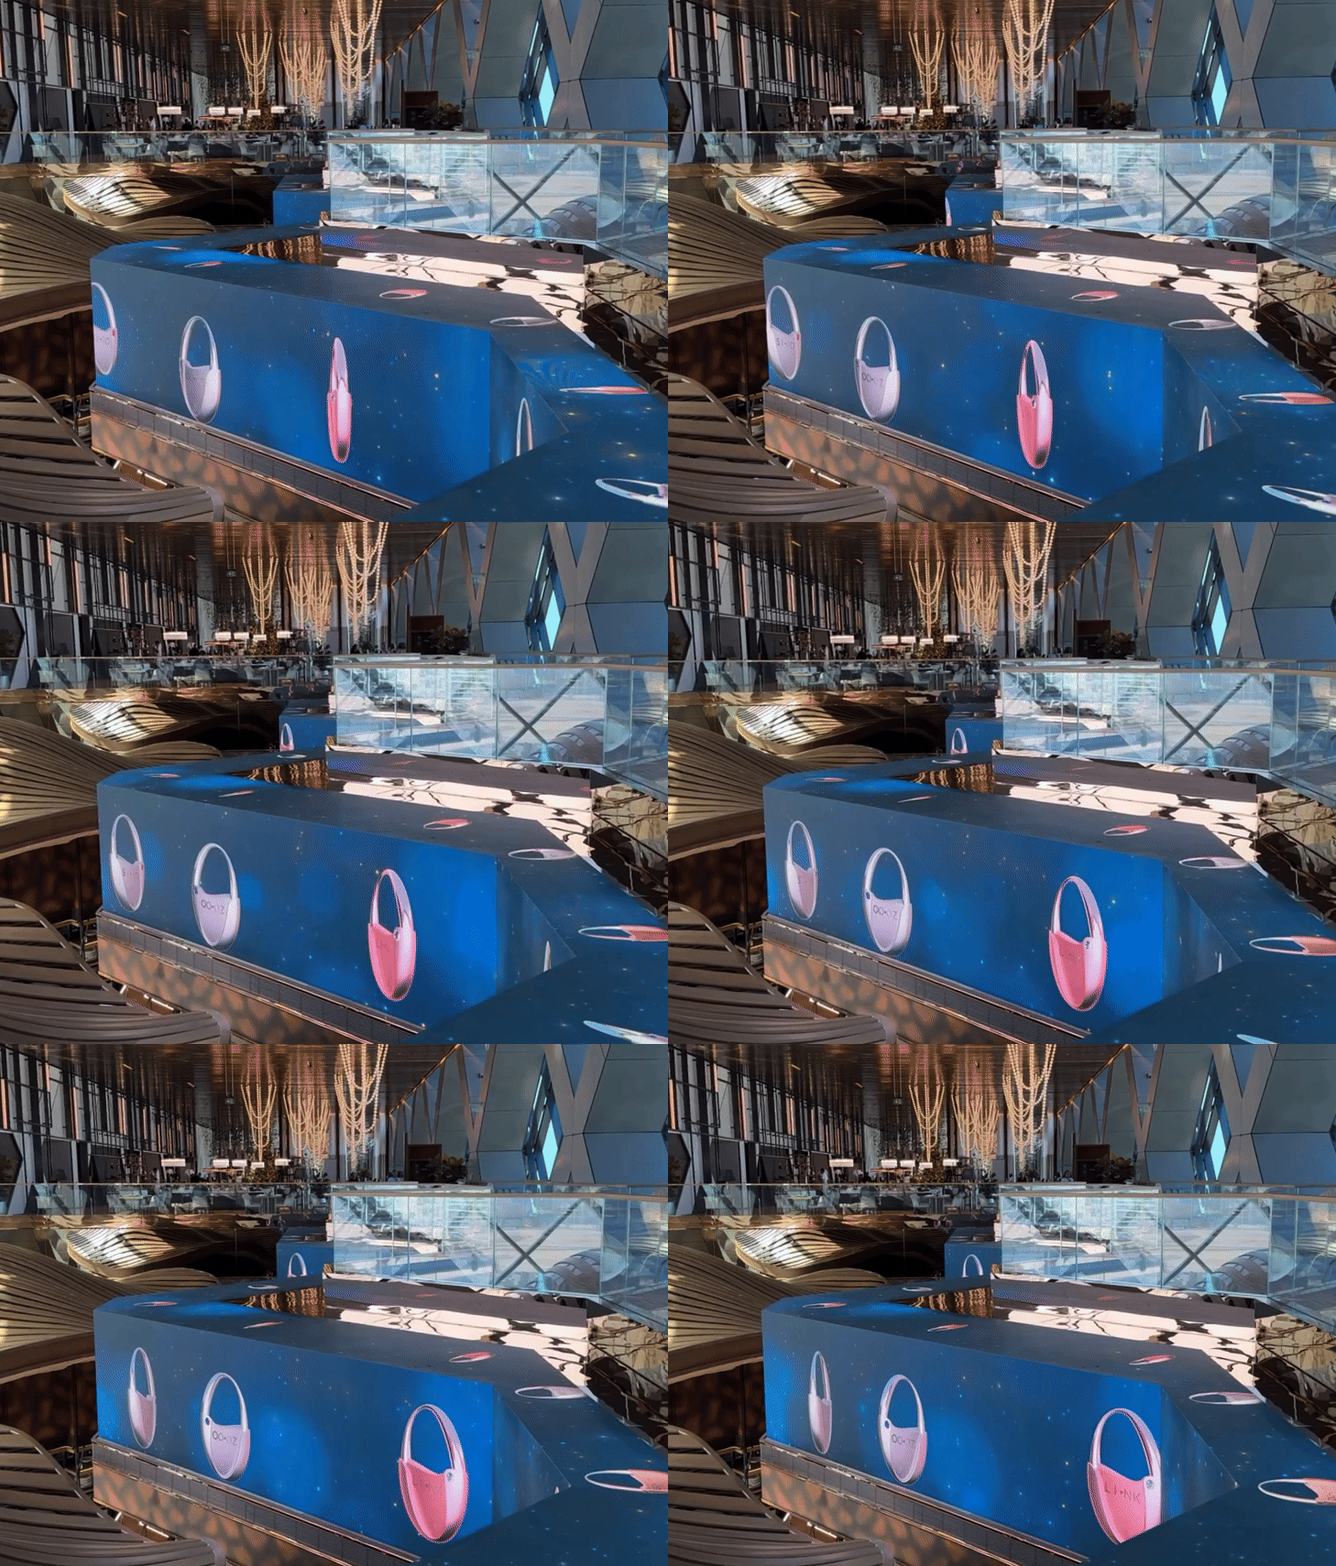
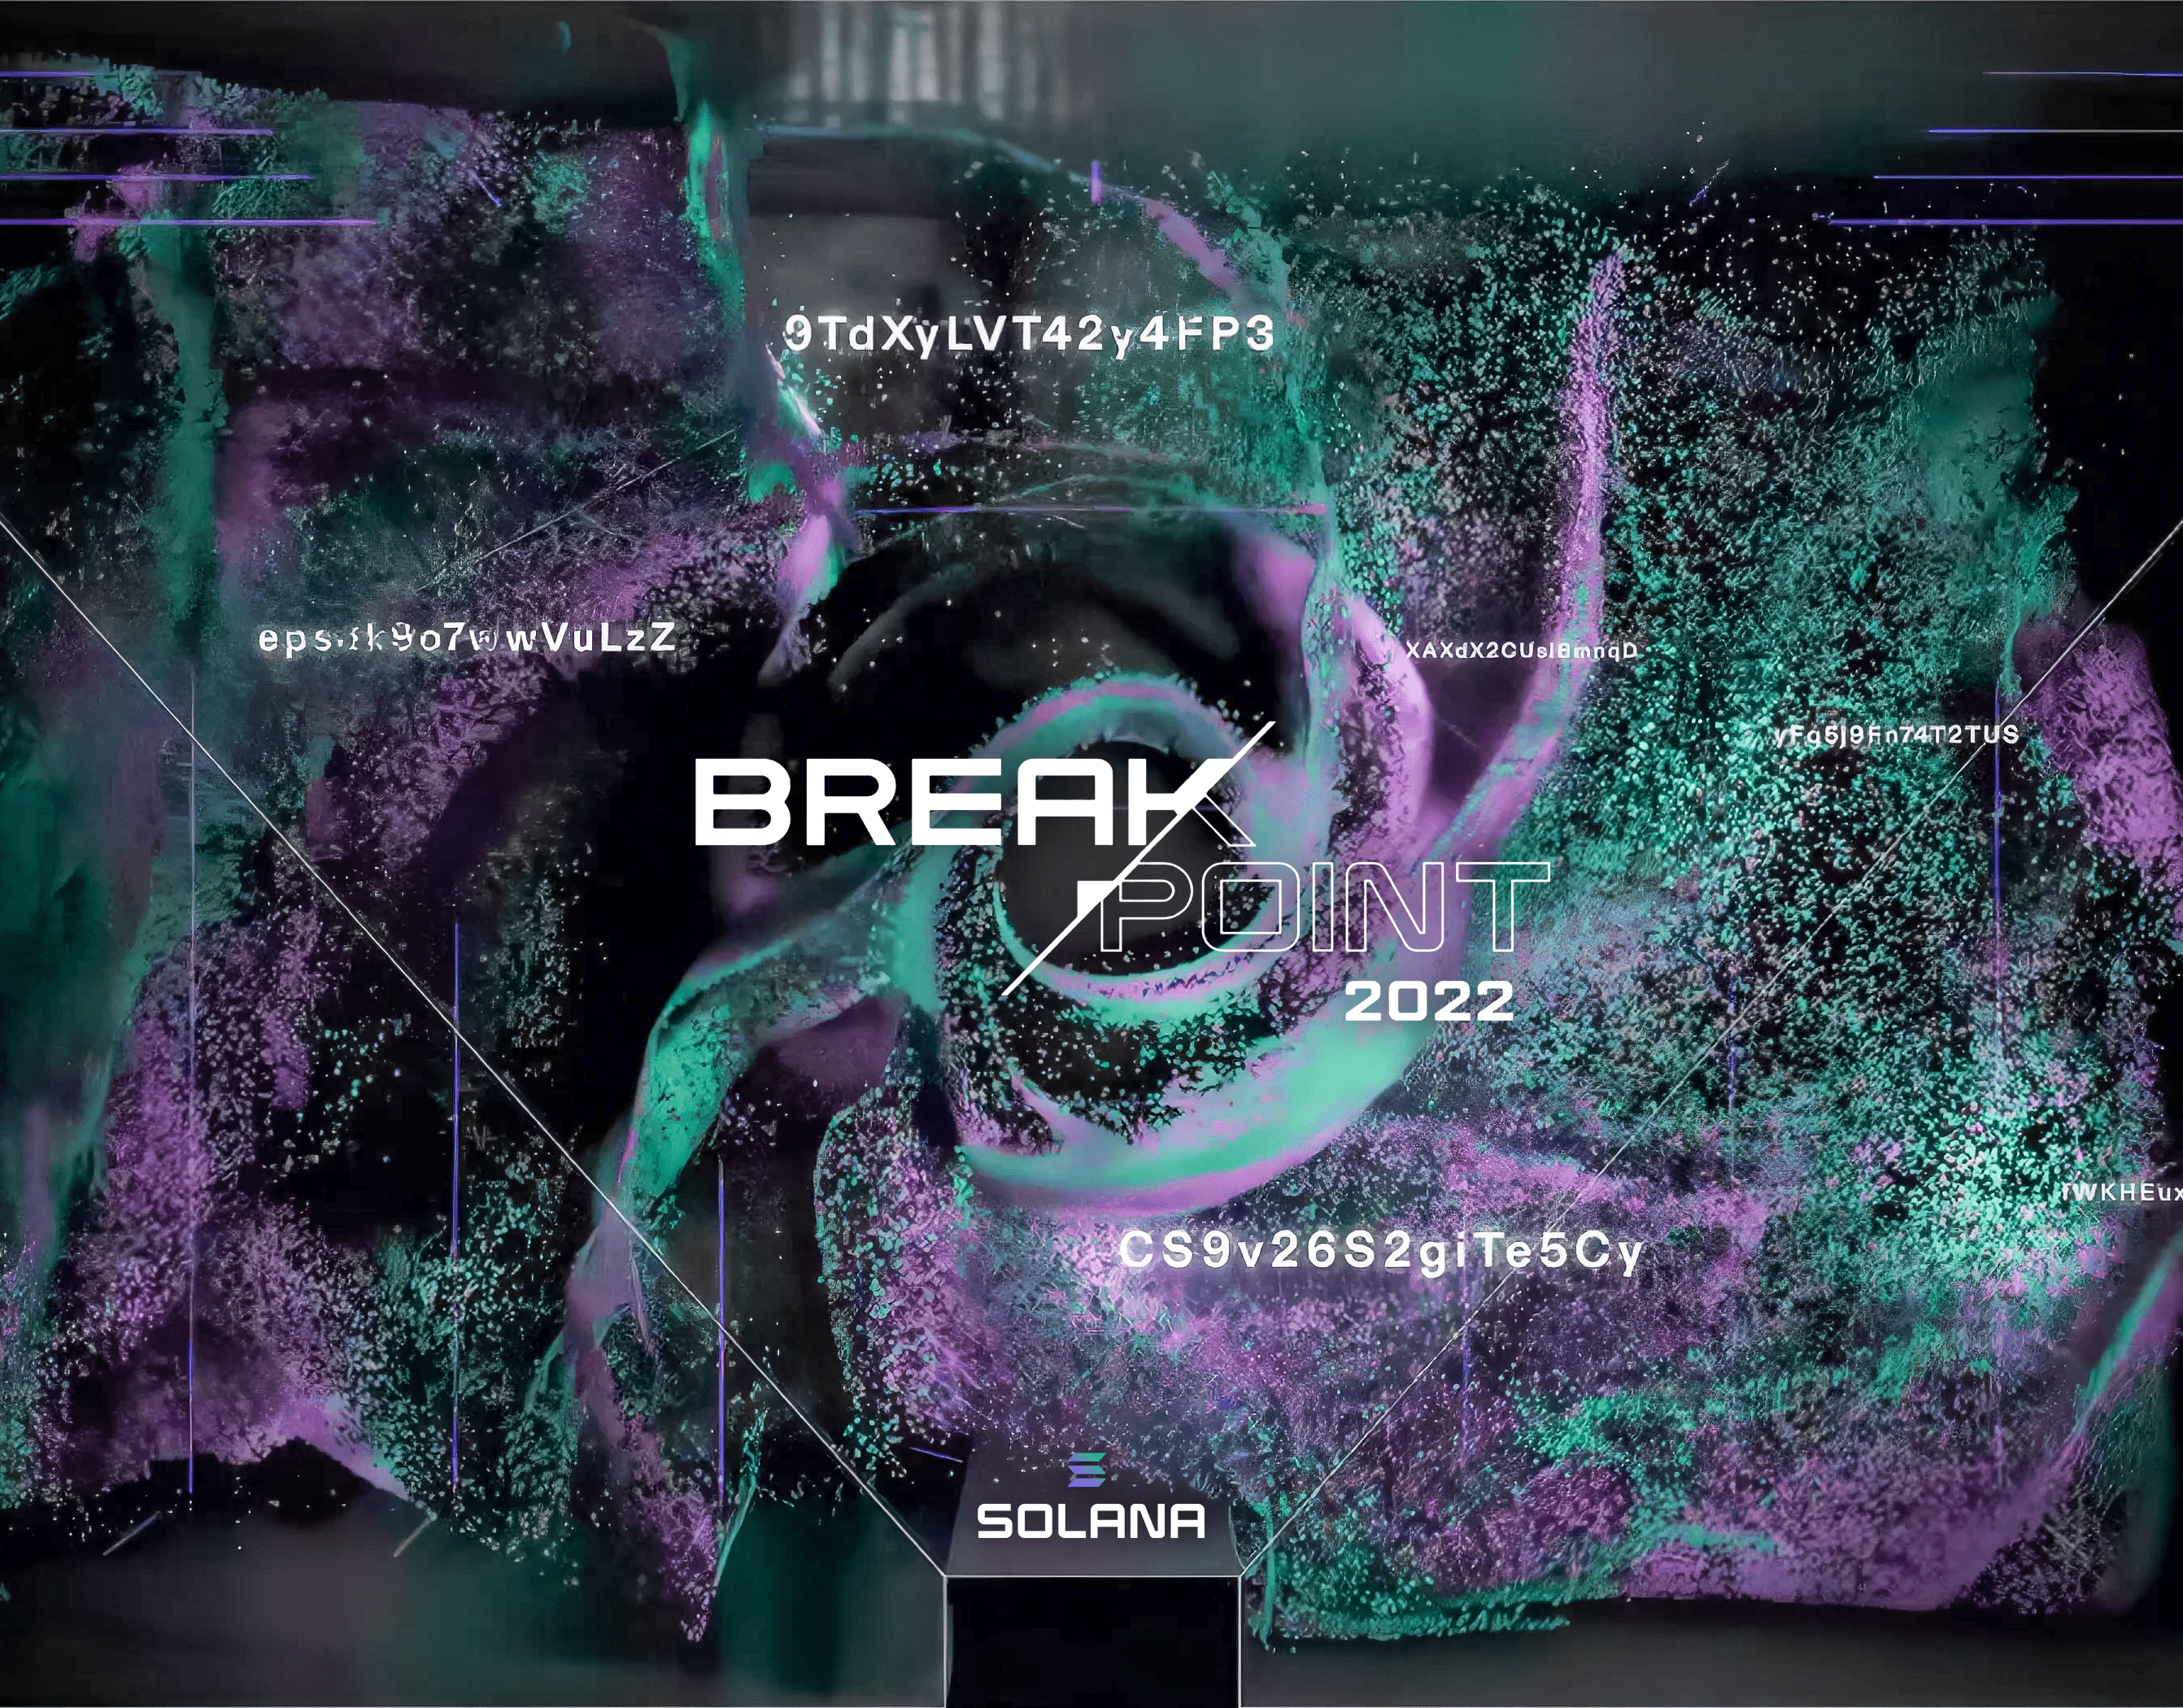
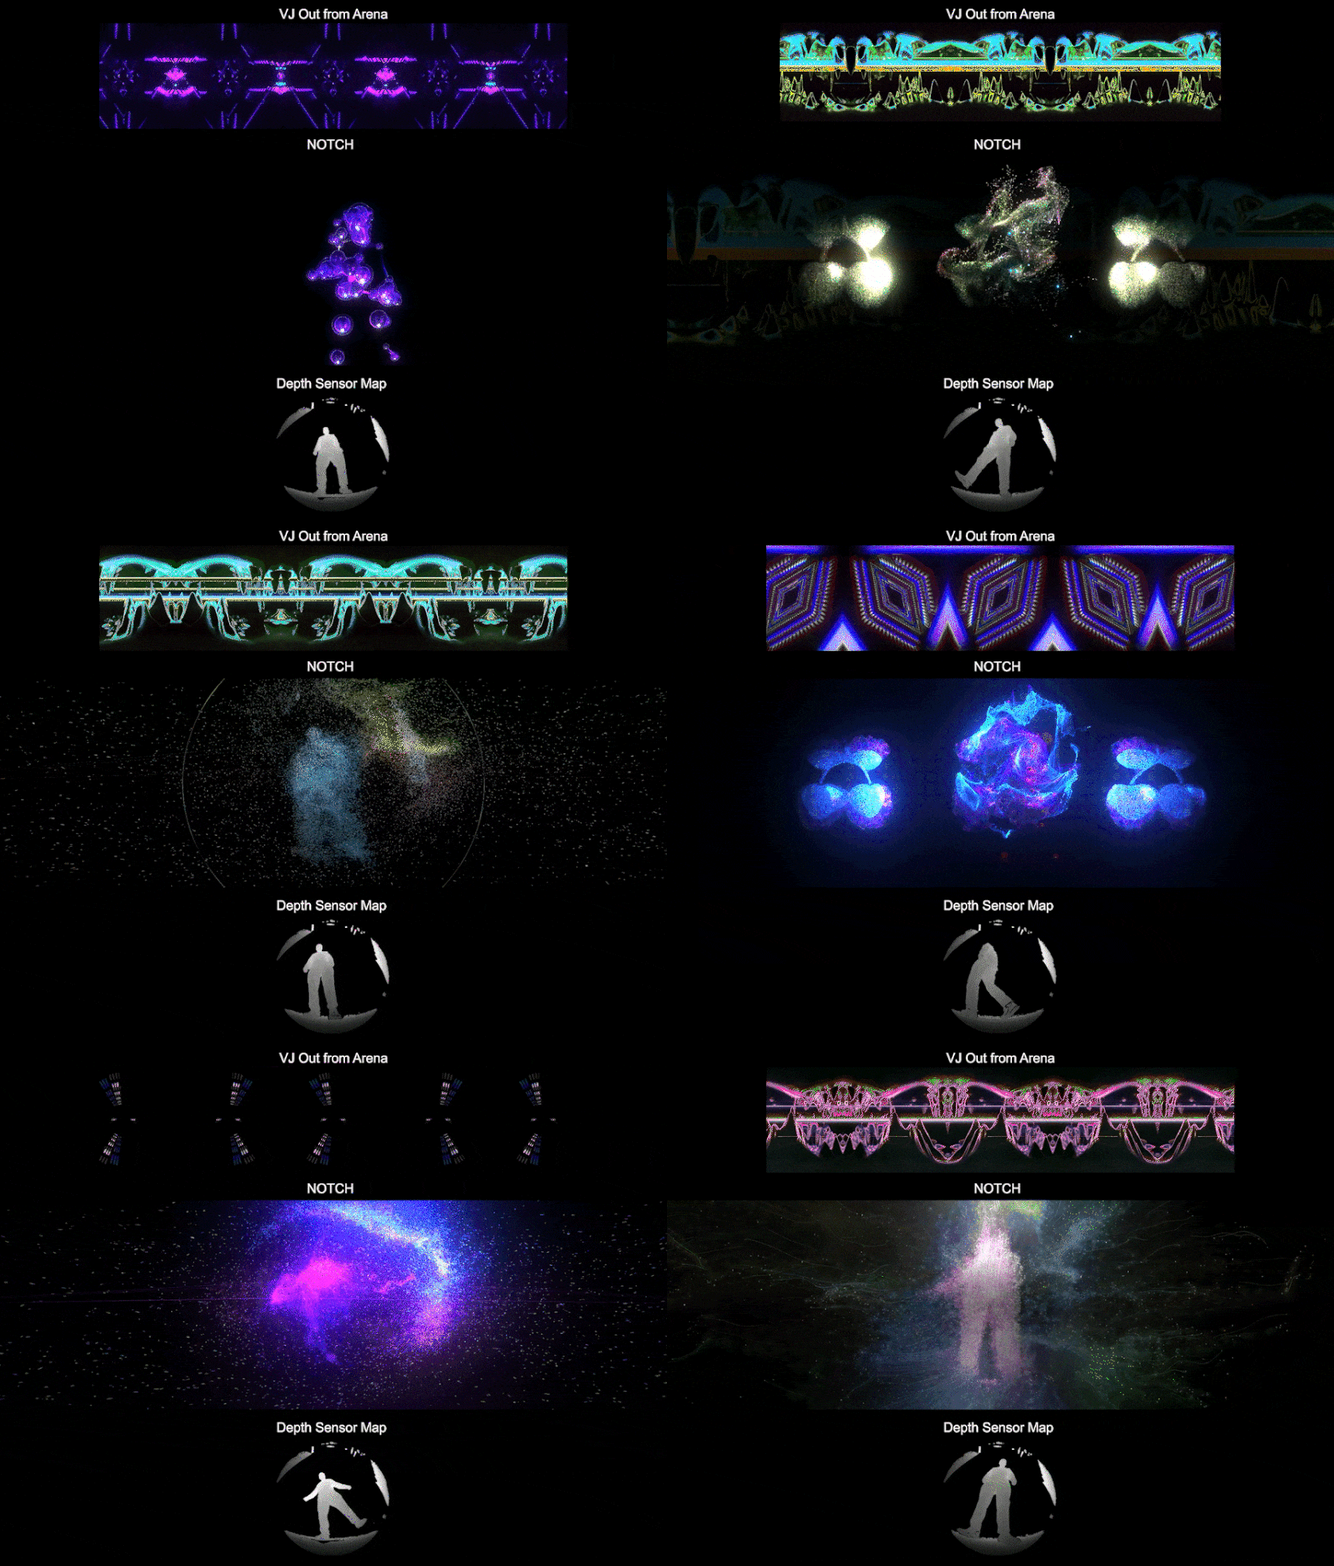
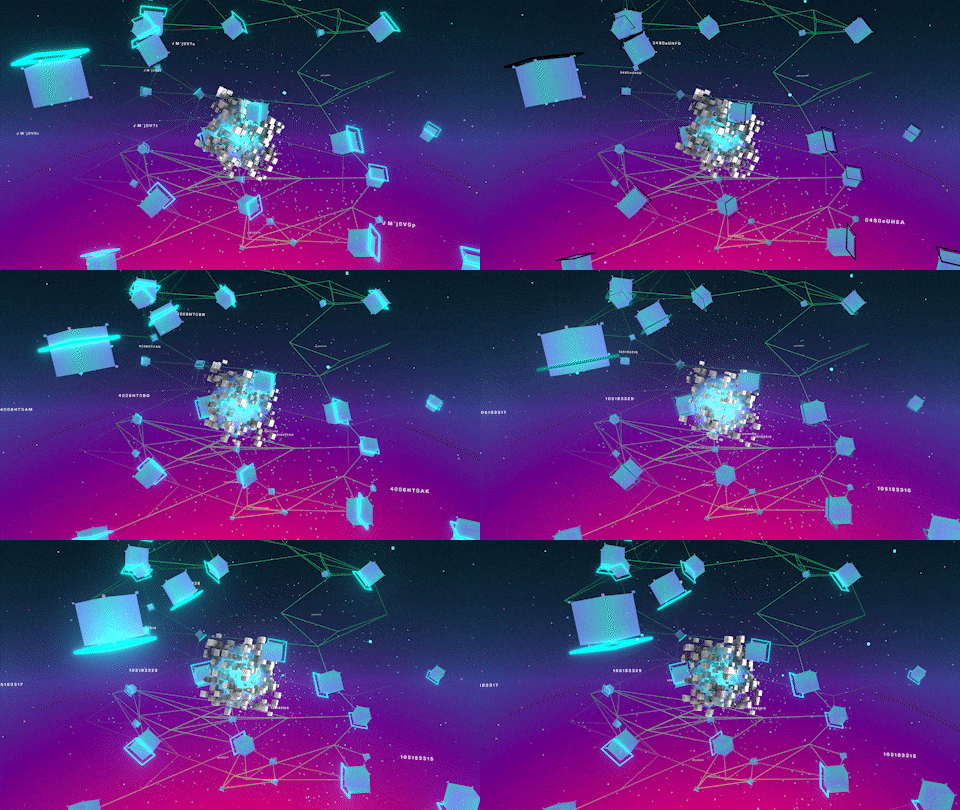
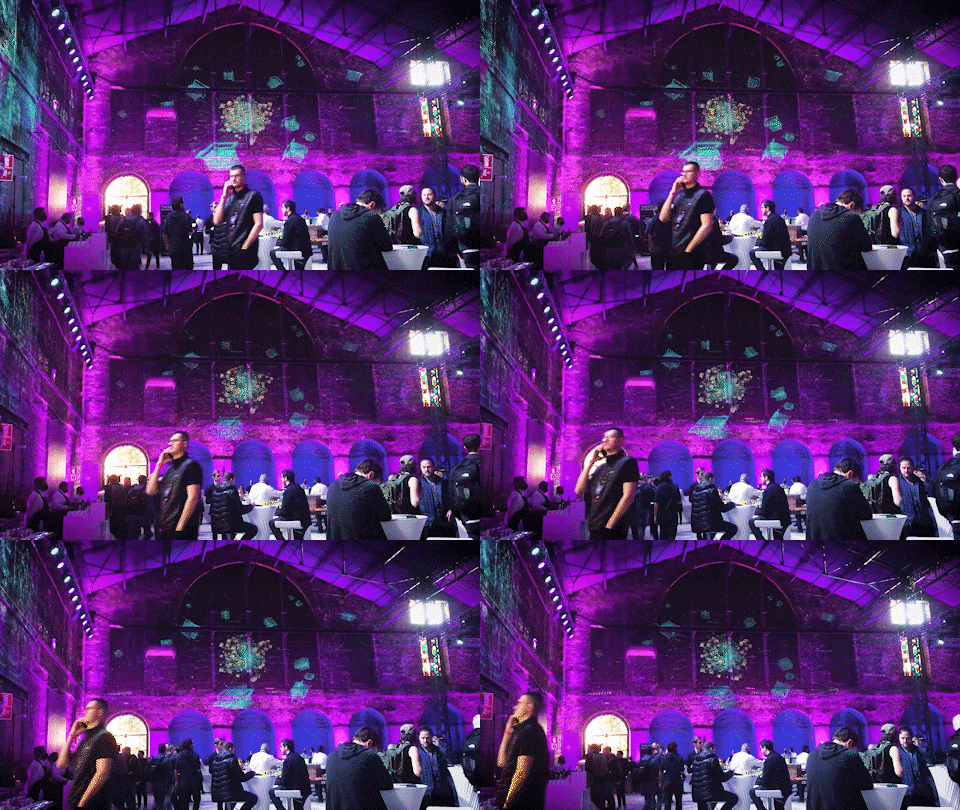
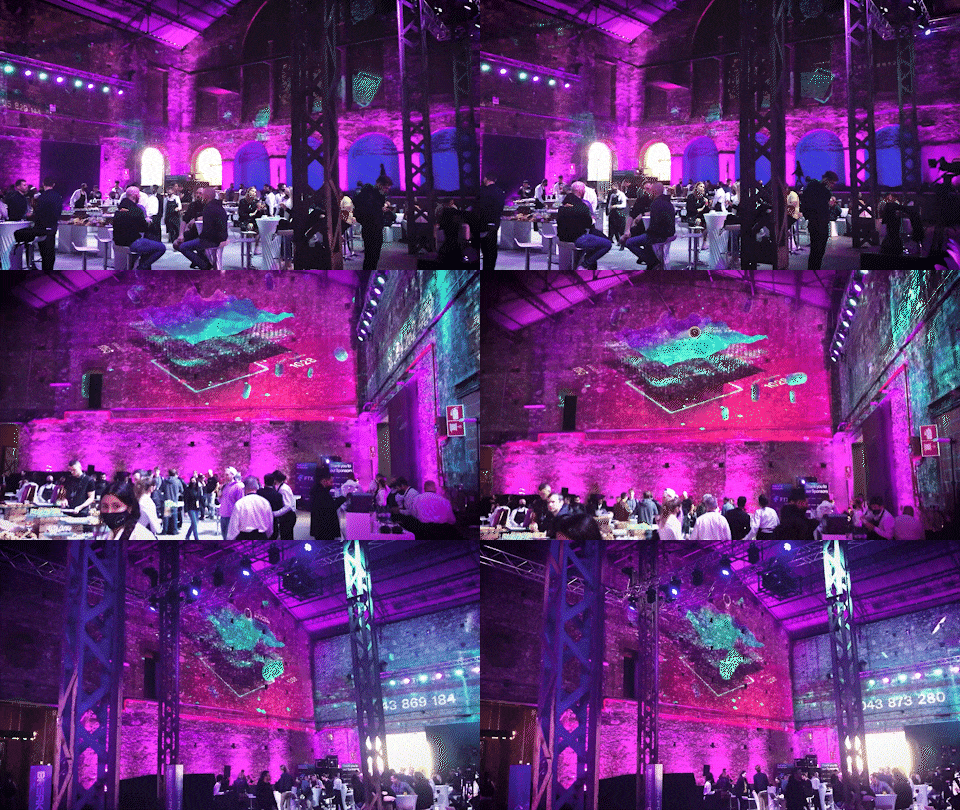
The first projection represented the map of the last validators and RPC Nodes; the second, in the middle, showed the Slot Height and the Total Transactions; at the end, the last, represented the Recent Blocks. The three projections were a side dish to the conference, throughout the event.


FINAL RESULT
CREDITS
Studio: ROOF Videodesign
Concept: Mikkel Garro Martinsen, Fausto Fasan, Lorenzo Venturini, Ryan Shea, Ross Cohen
Research: Fausto Fasan
JavaScript Developer: Luca Corsetti
Notch Designer: Lorenzo Venturini
Concept: Mikkel Garro Martinsen, Fausto Fasan, Lorenzo Venturini, Ryan Shea, Ross Cohen
Research: Fausto Fasan
JavaScript Developer: Luca Corsetti
Notch Designer: Lorenzo Venturini
Service: Europalco
Pandoras Box Operator: Nélio Lima
Pandoras Box Operator: Nélio Lima
Client: Solana
Event: Breakpoint
Location: LX Factory - R. Rodrigues de Faria 103, 1300-501 Lisboa, Portugal
Date: November 2021
Event: Breakpoint
Location: LX Factory - R. Rodrigues de Faria 103, 1300-501 Lisboa, Portugal
Date: November 2021
Press: Notch Showcase
